Google considers user experience in its search engine to rank pages.
It is not new. Already, some signals validate whether a web page is optimized for mobile or whether the website is secure.
In its journey to offer a “better web” and ever richer user-centric experiences, Google has opened the door with new on-page elements that will influence SEO on the midterm.
These signals relate to the page loading speed, responsiveness and visual stability. They bear the sweet name of Core Web Vitals and will be taken into account in Google Search’s algorithm in 2021.
It’s time for you to understand what the page experience means to Google, how to analyze it and ultimately improve the performance of your website.
Google and the user experience
Google’s mission is to provide the best experience for users of its search engine.
You might like or dislike it, but Google is shaping the Web and invites (or forces) website owners to follow the “best” practices.
For example, if tomorrow Google suggests that websites should have a red background, all sites will have a red background.
But of course, Google isn’t going to ask us to do something that doesn’t make sense…

Google’s initial mission (in 1998) was to organize the world’s information and make it universally accessible and useful.
For its 20th anniversary, Google reminded us of the fundamental principles of “Search”. The most important ones are:
- First and foremost, we focus on the user. Whether you’re looking for recipes, studying for an exam, or finding information on where to vote, we’re focused on serving your information needs.
- We strive to give you the most relevant, highest-quality information as quickly as possible.
To optimize content for SEO (or for Google) it is necessary to put the user in the centre and offer complete content, with structured information and also an excellent page experience.
Google wants quality pages that load quickly on its search engine.
Let’s have a look at the page experience and what it means for Google means.
What’s the page experience in Google’s eyes?
The Page Experience is a set of signals measured by Google to see if your pages provide a good experience when a user visits your site.
For example, Google tries to understand if your page loads fast and if it is optimized for mobile.
All of the following signals are taken into account to measure a “good page experience” in Google search :
- Mobile-friendly: Your page is optimized for mobile browsing.
- Safe-browsing: Your page does not contain any malicious (malware) or misleading content (phishing).
- HTTPS: The page is served in HTTPS.
- No intrusive interstitials: Your page should not have elements that obstruct your main content (such as a popup covering most of the content immediately after the user land on your page… so annoying).
- Core Web Vitals: The page provides a great user experience, focusing on the aspects of loading, interactivity and visual stability.
Most top-ranked websites are already implementing signals such as Mobile-Friendly, HTTPS, safe-browsing and no intrusive interstitials.
This study from 2018 shows that 75% of websites are mobile-friendly.
But do all these sites offer an exceptional experience?
Starting in 2021, Core Web Vitals will also be measured by Google to define page experience and will take into account the “speed” of a website.
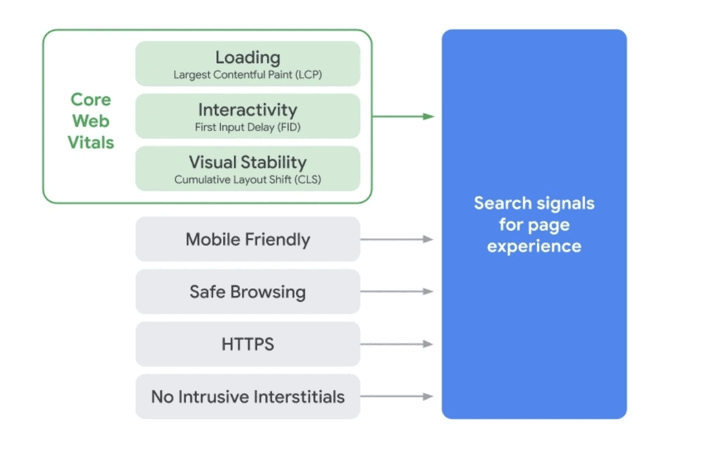
Let’s take a detailed look at what is behind the acronyms LCP, FID and CLS – the metrics of Core Web Vitals.
Core Web Vitals, soon vital for your SEO?
The goal of Core Web Vitals is to measure the actual user experience. These signals include loading performance, interactivity and visual stability of the page.
Core Web Vitals consist of three main signals:
- Largest Contentful Paint (LCP),
- First Input Delay (FID)
- Cumulative Layout Shift (CLS).

What are Core Web Vitals and what do they measure?
Let’s take a closer look at what’s behind Largest Contentful Paint (LCP), First Input Delay (FID) and Cumulative Layout Shift (CLS).
Largest Contentful Paint (LCP)
Largest Contentful Paint (LCP) measures page loading performance. To be more precise, LCP measures the perceived loading speed, i.e. how long it takes for your page to display the first elements that are important to the user.
It does not measure the complete loading of the page. You need to understand this difference.
To provide a good user experience, sites should strive to display the first “frame” of the content within 2.5 seconds.
It is Google’s standards. But we all agree that it’s more pleasant to have content that displays directly – no one likes to see blank pages.
A web page is displayed in stages. So in the early stages the top of your page loads, once the main elements are displayed, the LCP will be reached. That’s it!
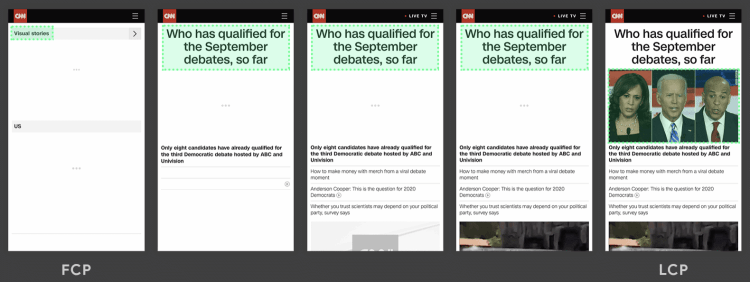
A fast LCP allows you to “convince” the user about the interest of your page. We know that the first few seconds are crucial to avoid a “bounce back”.
Keep in mind: Google takes into account the dwell time as a signal of referencing, so it is better to keep visitors on your site.
First Input Delay (FID)
The First Input Delay (FID) measures the “responsiveness” of a page. It measures the time between when a user first interacts with your page (i.e., when they click on a link or button) and when the browser is actually able to respond to that interaction.

You have an excellent FID if the interaction with your page (like clicking a button) takes less than 100ms to trigger the next action.
The FID can be seen as a measure of user frustration. Indeed, there is nothing more frustrating than sending a form or clicking a button that takes seconds to trigger the next step.
Zero frustration equals a near-zero FID. Or the other way around…
Cumulative Layout Shift (CLS)
The Cumulative Layout Shift (CLS) measures visual stability and the frequency with which users experience unexpected layout changes.
A visual change occurs every time an element on your page changes its position unexpectedly.
Here an example of a visual change: You are reading a paragraph, and suddenly it disappears. The section is replaced by a button (which has just finished loading). You need to scroll down to resume reading.
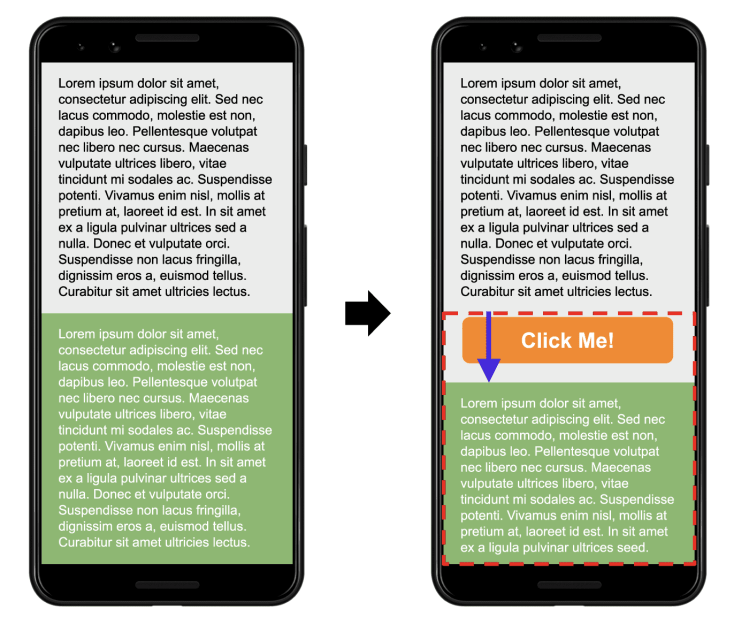
The CLS calculation is based on various examinations and movements of elements within the browser while the page is loading.
You have to have a score close to zero to be considered excellent.
Core Web Vitals in a nutshell
- LCP: The time to see the first elements of the page. It gives a feeling of speed.
- FID: The time for the first interaction (like a click). It indicates potential user frustration if it is too slow.
- CLS: Visual stability to avoid any “Where is the paragraph I was reading? S*** I have to scroll down again” feeling by your visitor
The impact of Core Web Vitals on SEO
First of all, Google does not yet use Core Web Vitals in its search algorithm. These signals will be taken into account by Google in 2021, and the exact date is not known.
The most relevant content will always be the first
Google indicates that the pages with the best information, even if the experience of the pages is lower, will have a better ranking.
The quality of the content (and the number of backlinks) will for now have priority over the page experience.

However, in cases where pages may be similar in terms of relevance, the pages with the best experience will rank first.
In our world of information in constant competition, the user experience could be the differentiating factor in the future.
Top Stories on mobile
Currently, the pages in the Top Stories on mobile phones are exclusively in AMP format.
As a reminder, the AMP format offers mechanisms for fast page loading on mobile phones. By the way, this format is also directly supported by Google.
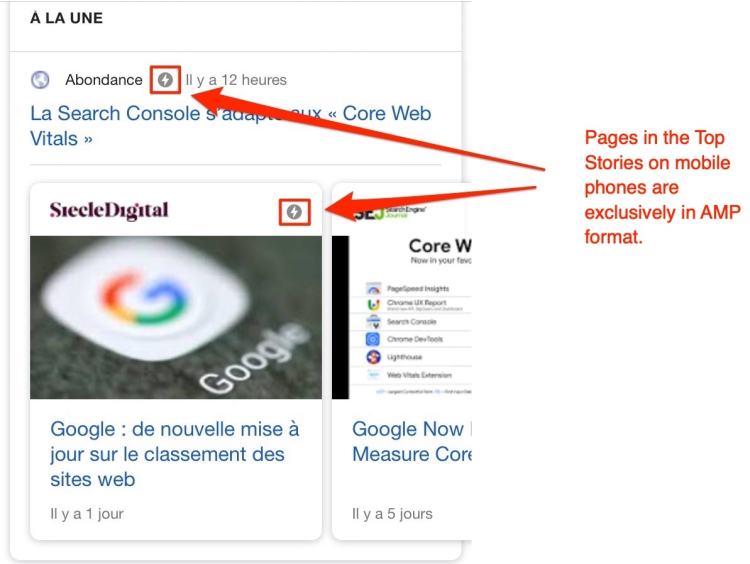
Google indicates that the Top Stories will accept all types of pages when the Search will actively use the Core Web Vitals signals.
What you need to understand: Only pages with excellent user experience and good load time will be eligible for the Top Stories section, without necessarily using AMP technology.
Tools to test and measure page experience and Core Web Vitals
The table is summarizing the tools or methods to test the different signals already used by Google and related to the page experience.
| Signal | Testing tool |
| Mobile Friendly | Enter the URL of your site or page in the Mobile-Friendly Test |
| Safe-browsing | Check if your site is secure here Security Issues report – Search Console Help |
| HTTPS | Open your site with Chrome, and if you see a padlock next to the URL it means your site is in HTTPS. |
| No intrusive interstitials | No tools to help you, but you can run manual tests or use your eyes. |
Concerning the Core Web Vital, there is another set of tools that we will see in detail.
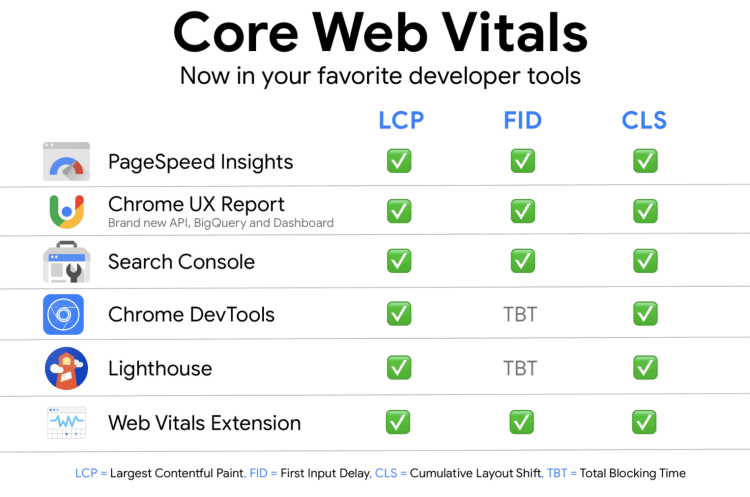
Web Vitals
Web Vitals is a Chrome extension that allows you to see at a glance how your page is measured against metric LCP, FID, CLS.
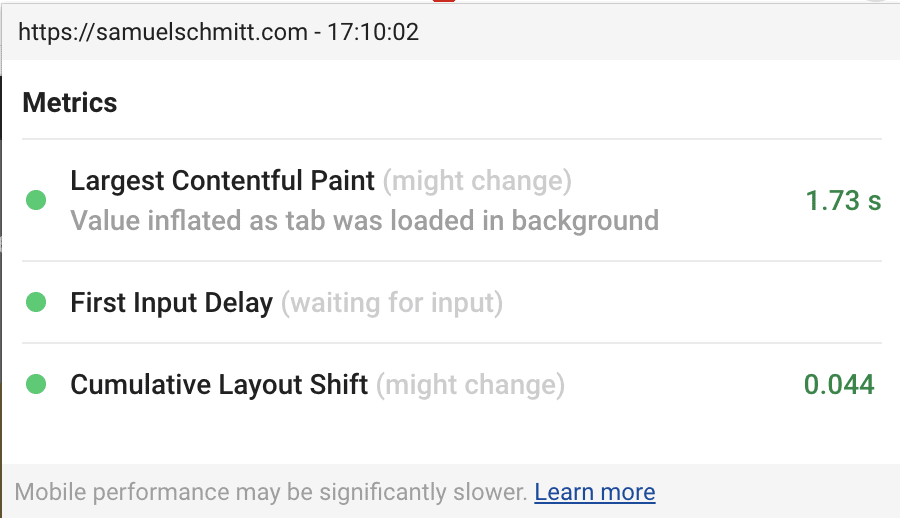
Lighthouse
Lighthouse is an automated audit tool and produces a diagnostic report to improve the user experience by showing you the problems found on your page.
Lighthouse is directly integrated into the Chrome development tools, under the “Audits” panel.
It is possible to install Lighthouse via a Chrome extension.
Since Lighthouse 6.0, settings related to Core Web Vitals such as LCP and CSL are available in the report from the performance section.
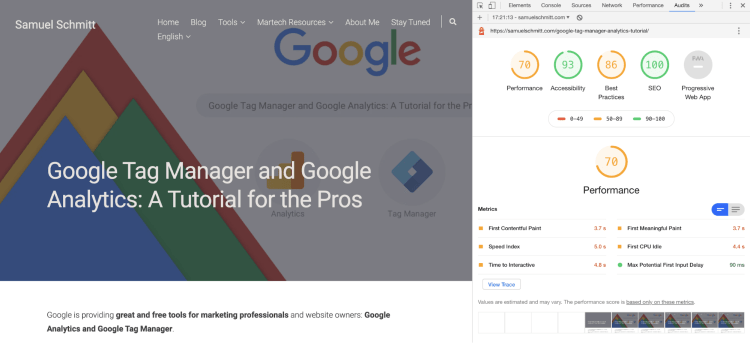
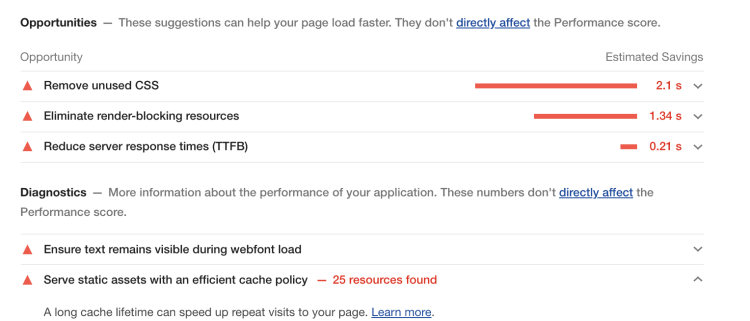
Lighthouse indicates opportunities for improvement, and as you can see, I have some work to do on the performance of my site.
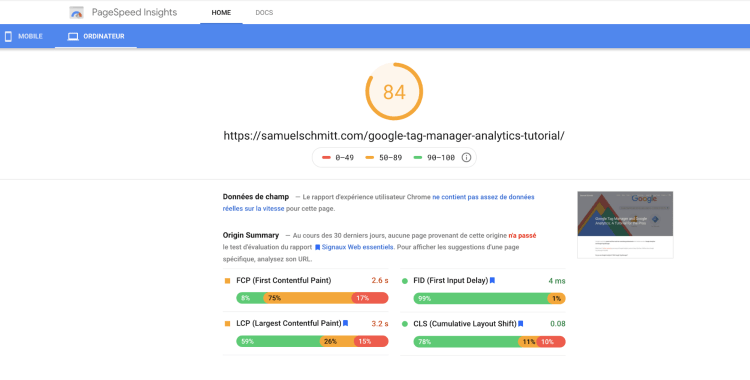
Page Speed Insights
Page Speed Insights is accessible from this link and will give you information about the loading speed of a web page to optimize its performance.
Chrome UX Report (CrUX)
The Chrome UX Report (CrUX) is a set of public data on the real user experience on millions of websites.
This data is retrieved by Google when a user agrees to send statistics via Chrome or other services. (You know that checkbox!? Now we know…)
This database comes with an API that allows any developer to retrieve performance data for any sites: your site or your competitors’ websites.
It is the only reliable way to know how your users feel about the performance of your site.
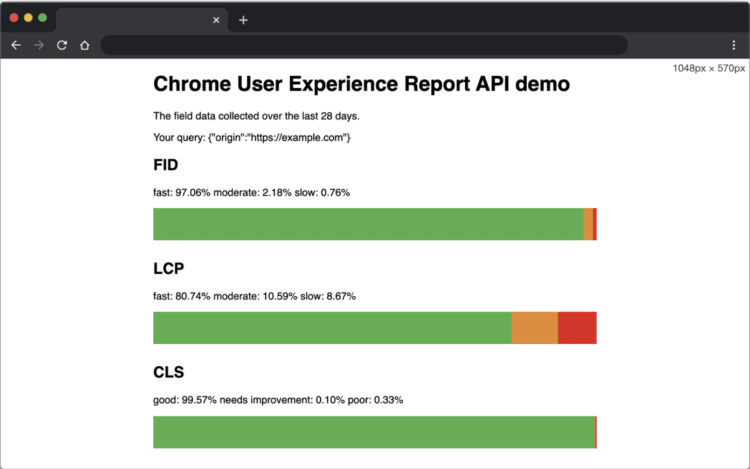
You need coding skills to exploit this database and integrate it into your website diagnostic workflow.
To start with the CrUX API, it’s here.
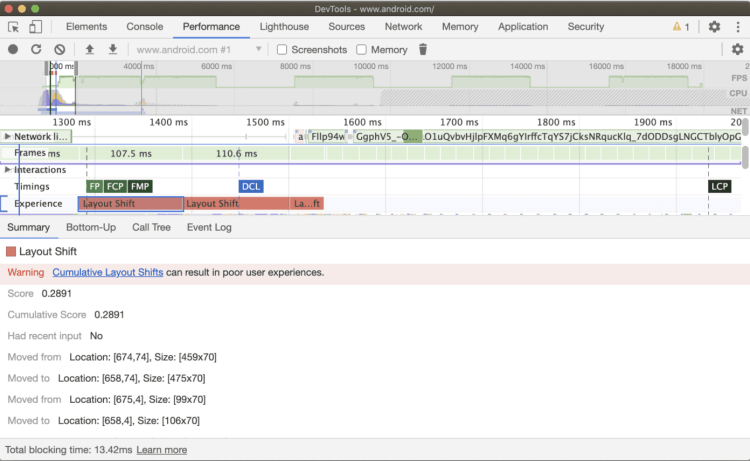
The Chrome DevTools Performance Panel
The Chrome DevTools Performance panel includes a new Experience section that can help you detect unexpected layout changes.
This section is useful to find and correct visual instability problems on your page and fix the cumulative layout shift (CLS).
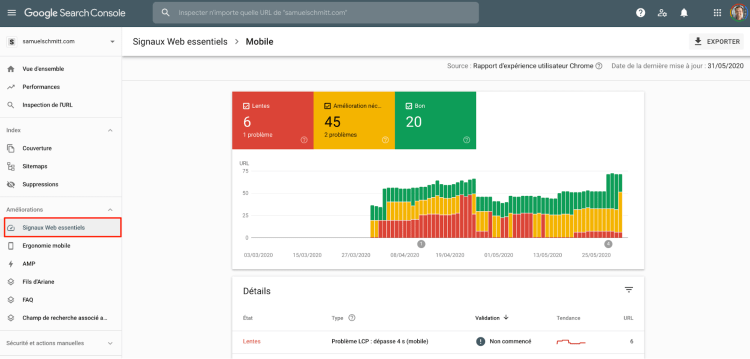
Core Web Vitals in Search Console
Core Web Vitals report is available from Google Search Console.
This report tells you which groups of pages on your site need special attention, based on actual data from the CrUX.
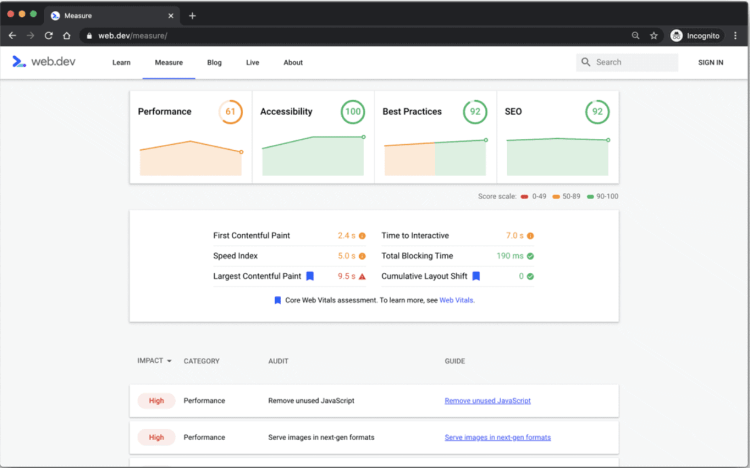
web.dev
web.dev allows you to measure the performance of your page over time. The data is the same as the Page Speed Insight report.
One comment on Field data vs Lab data
You have noticed that the tools provide real data and/or simulated data (Field Tools vs Lab Tools).
The real data is based on statistics collected by Google. Each time someone visits a website, they sent data to Google about the performance (only if they opted in).
The data are real and are more accurate than simulated data.
Now that you know all the tools for testing performance let’s try to see how to use them.
Discover thruuu – A free Google SERP Scraper here.
Optimize the user experience and the Core Web Vitals step-by-step
To get started with optimizing your website, Google recommends following these steps:
Step 1 – Start from Google Search Console
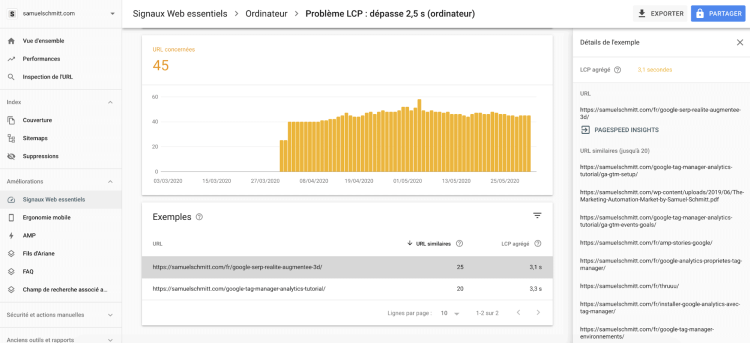
Go to Google Search Console and open the “Core Web Vitals” report to identify pages that need special attention.
The pages are grouped by problem type. Here you can see that all the pages on my site have a slightly too high LCP (first display).
As I use a CMS (WordPress), if I fix the problem for one page, all the pages should be fixed.
Step 2 – Analyzing pages with PageSpeed Insights
From the Search Console, you can click directly on the button opening PageSpeed Insights.
You will find a first report with suggestions for improvement.

In my case, it seems that CSS and Javascript resources block the rendering of my page. I should look in detail what’s going on there.
Step 3 – More data with Lighthouse
Now run the test with Lighthouse. You should observe that Lighthouse and PageSpeed Insight display similar improvement opportunities.
In Lighthouse, you will also find additional information.
Step 4 – Prioritize with web.dev
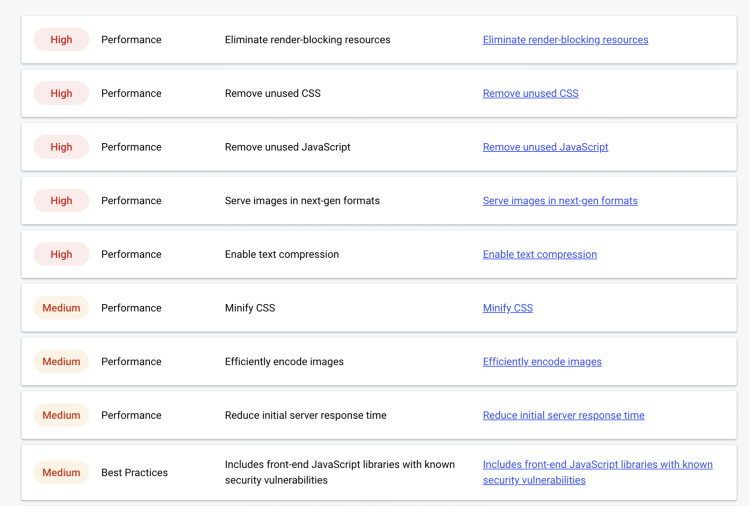
You can also start the audit of your page via web.dev/measure. This report gives you an overview of the elements in order of priority.
It’s helpful when you don’t know where to start.
Step 5 – Resolve the problems of your site
As a result of this initial analysis, you have now identified many issues that need to be addressed.
Each website has its own problems. Let’s try to study the most common ones and also to define the best practices for optimizing a website.
Tips and best practices for the optimization of your website
Website optimization issues are often due to a technical problem.
For problems related to the page (client-side), such as CSS and Javascript, a web developer will be useful to modify the code of your page.
For problems related to your CMS or infrastructure (server-side), a backend developer or DevOps will be needed.
Keep in mind: To improve the performance of your website, you need a technical background – or you can contact a web developer.
Nevertheless, some improvements are simple. Let’s go through them first.
Optimize your website without coding
If you follow these best practices, you could already have a well-performing website:
- Compress your images
- Replace Animated GIFs with videos
- Use new generation image formats such as WebP or JPEG 2000 (but unfortunately these formats are not yet supported by all browsers)

These are good practices that can already optimize your website.
Optimize your website – for advanced users
If you are a developer or a seasoned user who is not afraid to get your hands dirty, here are some recommendations and best practices:
- Reduce the size of each page to less than 500KB (page + all resources).
- Keep the total number of resources per page to less than 50 (ideal for mobiles).
- Consider the implementation of AMP framework, which can solve many loading problems on mobile phones
- Lazyload your images
- Using a CDN for your images and other assets
And to continue with the critical points requiring developer support, let’s detail some common performance-related issues of web pages.
Use one image for desktop and one for mobile
It is possible to create variations of the same image and indicate them in the HTML code. This way, depending on the screen size, the right image at the right size will be displayed.

Eliminate render-blocking resources
There are some Javascript and CSS that are not used during the initialization of your page.
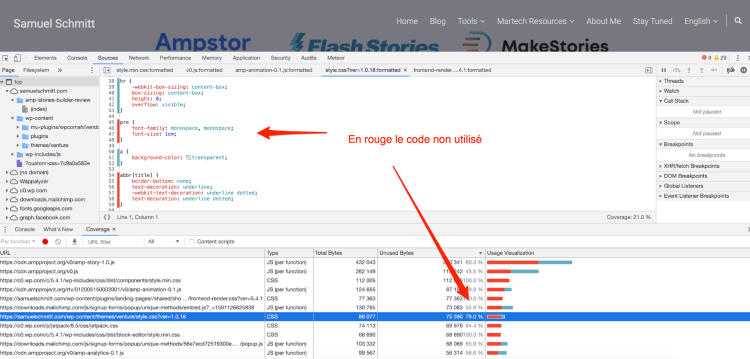
Identify these resources with the Chrome DevTools from the Coverage tab. It tells you which resources are executed and which are “just” loaded.
The “just” loaded resources can be executed later with the attribute async or defer.
This way, the first element will load faster, and your LCP will be improved.
Remove useless CSS and JS
In your CSS and JS files, there are bits of code that are never used, and despite this, they are “read” entirely when your page loads. These data are loaded and processed unnecessarily.
The Chrome DevTools Coverage tab will still be useful to understand the percentage of unnecessary code in your CSS or Javascript files.
Then it will be necessary to check in each file the code and remove it if necessary.
Compress server-side resources
Lighthouse detects files that do not have content-encoding such as br, gzip or deflate.
It is recommended to compress them. This operation must be done on the server-side, for example, in your CMS.
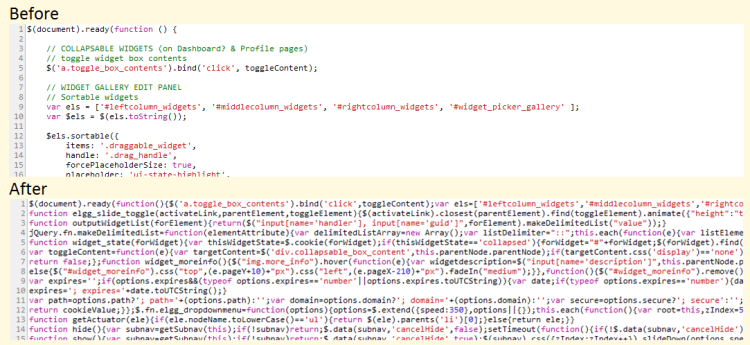
Minify CSS and JS
CSS and JS can be minified, i.e. displayed on one line and therefore took up less space. It is a relatively simple operation and can be done with an online tool.
Always include size attributes on your images and video elements
This approach ensures that the browser can allocate the right amount of space in the document while the images are loading.
Test before updating your changes
The last tip: test your modifications correctly. Do not change directly on your production website.

To Recap
Improving the experience page is a rather complex topic and requires technical knowledge to be able to solve it.
You must ask yourself if it is worth to invest time in an improvement that won’t “necessary” influence your SEO.
You are the only judge here.
Keep in mind that Google will focus more and more on the user experience. On the long term, these factors will get more importance in the SEO.
In your next projects, start thinking about optimization right from the start.
Editor’s note: No optimization has been done on my website yet, but thanks to these researches, I have a better understanding of what “Page Experience” means. Hopefully you too! As soon I discover new tips, tools or WordPress plugins to help with optimization, I will update this page. So if you’re interested, join the newsletter to stay tuned.
Discover thruuu – A free Google SERP Scraper here.
